- Home
- Census Atlas
- Communities
- Ukrainian
The Ukrainian community in Canada.
In the 2021 Census, 1,258,635 people reported Ukrainian origin, alone or with other origins. Edmonton had the largest number (151,575). 81,135 immigrants were born in Ukraine, 14,515 of them arriving from 2016 to 2021.
Data 2021 CensusNext update Census 2026 (from Feb. 2027)
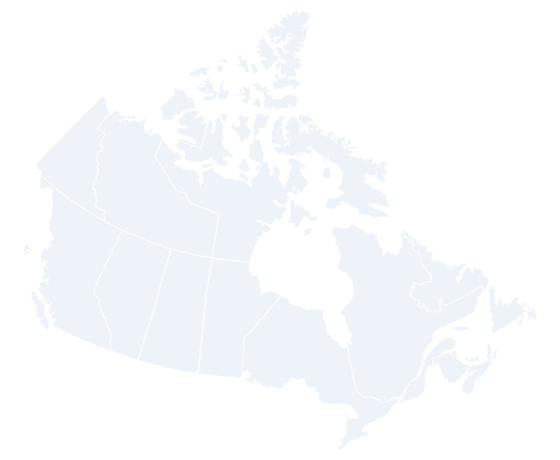
People of Ukrainian origin by metropolitan area
Circle area shows the number of people. Select a circle for the city profile.
| Metropolitan area | People |
|---|---|
| Edmonton | 151,575 |
| Toronto | 122,925 |
| Winnipeg | 108,005 |
| Calgary | 81,955 |
| Vancouver | 81,155 |
| Saskatoon | 46,250 |
| Montréal | 31,115 |
| Regina | 29,230 |
| Ottawa - Gatineau | 28,295 |
| Hamilton | 26,060 |
| St. Catharines - Niagara | 19,275 |
| Victoria | 18,825 |
| Kelowna | 17,065 |
| Thunder Bay | 14,090 |
| Kitchener - Cambridge - Waterloo | 12,570 |
| Oshawa | 11,505 |
| London | 11,405 |
| Windsor | 10,800 |
| Abbotsford - Mission | 8,670 |
| Kamloops | 7,940 |
| Red Deer | 7,890 |
| Lethbridge | 7,845 |
| Greater Sudbury / Grand Sudbury | 7,570 |
| Barrie | 6,325 |
| Chilliwack | 6,110 |
| Nanaimo | 5,710 |
| Halifax | 5,655 |
| Brantford | 4,625 |
| Guelph | 4,015 |
| Kingston | 3,415 |
| Peterborough | 2,430 |
| Belleville - Quinte West | 1,970 |
| Québec | 1,355 |
| Moncton | 1,125 |
| Fredericton | 1,010 |
| St. John's | 960 |
| Saint John | 850 |
| Sherbrooke | 355 |
| Trois-Rivières | 165 |
| Saguenay | 150 |
| Drummondville | 120 |
Source: Statistics Canada, Census Profile, 2021 Census of Population; Statistics Canada, 2021 Census boundary files (simplified).
Top 15 metropolitan areas
| Metropolitan area | People | Share of residents |
|---|---|---|
| Edmonton | 151,575 | 10.8% |
| Toronto | 122,925 | 2.0% |
| Winnipeg | 108,005 | 13.2% |
| Calgary | 81,955 | 5.6% |
| Vancouver | 81,155 | 3.1% |
| Saskatoon | 46,250 | 14.8% |
| Montréal | 31,115 | 0.7% |
| Regina | 29,230 | 11.9% |
| Ottawa - Gatineau | 28,295 | 1.9% |
| Hamilton | 26,060 | 3.4% |
| St. Catharines - Niagara | 19,275 | 4.5% |
| Victoria | 18,825 | 4.8% |
| Kelowna | 17,065 | 7.8% |
| Thunder Bay | 14,090 | 11.6% |
| Kitchener - Cambridge - Waterloo | 12,570 | 2.2% |
Source: Statistics Canada, Census Profile, 2021 Census of Population.
By province and territory
| Province | People |
|---|---|
| Alberta | 343,640 |
| Ontario | 342,260 |
| British Columbia | 210,100 |
| Manitoba | 165,305 |
| Saskatchewan | 138,705 |
| Quebec | 38,685 |
| Nova Scotia | 9,630 |
| New Brunswick | 4,600 |
| Yukon | 1,975 |
| Newfoundland and Labrador | 1,505 |
| Prince Edward Island | 1,050 |
| Northwest Territories | 1,030 |
| Nunavut | 160 |
Source: Statistics Canada, Census Profile, 2021 Census of Population.
Related languages spoken most often at home
Canada. Not everyone who speaks these languages reports this origin.
| Language | People |
|---|---|
| Ukrainian | 27,825 |
Source: Statistics Canada, Census Profile, 2021 Census of Population.