- Home
- Census Atlas
- Recent immigrants
Where recent immigrants settled.
1,328,240 people who immigrated from 2016 to 2021 were living in Canada on Census Day, 3.7% of the population.
Data 2021 CensusNext update Census 2026 (from Feb. 2027)
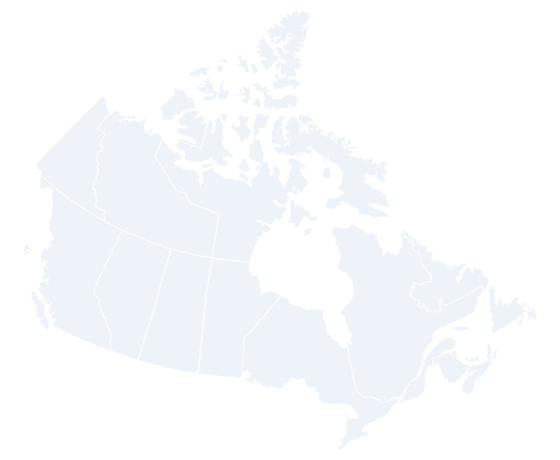
Recent immigrants as a share of residents
2016 to 2021 arrivals.
| Province or territory | 2016 to 2021 |
|---|---|
| Alberta | 4.6% |
| Manitoba | 4.5% |
| Ontario | 4.2% |
| British Columbia | 4.0% |
| Saskatchewan | 3.9% |
| Prince Edward Island | 3.2% |
| Yukon | 2.8% |
| Quebec | 2.4% |
| Nova Scotia | 2.2% |
| New Brunswick | 2.1% |
| Northwest Territories | 2.0% |
| Newfoundland and Labrador | 0.8% |
| Nunavut | 0.7% |
Source: Statistics Canada, Census Profile, 2021 Census of Population; Statistics Canada, 2021 Census boundary files (simplified).
Recent immigrants by metropolitan area
Circle area shows the number of recent immigrants.
| Metropolitan area | People |
|---|---|
| Toronto | 391,680 |
| Montréal | 162,255 |
| Vancouver | 154,820 |
| Calgary | 85,620 |
| Edmonton | 74,700 |
| Ottawa - Gatineau | 58,295 |
| Winnipeg | 46,500 |
| Kitchener - Cambridge - Waterloo | 27,780 |
| Hamilton | 26,545 |
| London | 20,495 |
| Halifax | 18,135 |
| Saskatoon | 17,515 |
| Windsor | 15,830 |
| Regina | 14,980 |
| Québec | 14,315 |
| Oshawa | 11,555 |
| Victoria | 10,080 |
| St. Catharines - Niagara | 8,220 |
| Abbotsford - Mission | 6,845 |
| Moncton | 6,460 |
| Guelph | 6,000 |
| Kelowna | 4,300 |
| Barrie | 4,160 |
| Sherbrooke | 4,145 |
| Red Deer | 3,920 |
| Fredericton | 3,725 |
| Lethbridge | 3,640 |
| St. John's | 3,085 |
| Saint John | 3,055 |
| Kingston | 2,725 |
| Nanaimo | 2,355 |
| Brantford | 2,270 |
| Chilliwack | 1,695 |
| Greater Sudbury / Grand Sudbury | 1,655 |
| Kamloops | 1,485 |
| Trois-Rivières | 1,455 |
| Peterborough | 1,300 |
| Thunder Bay | 1,095 |
| Drummondville | 980 |
| Belleville - Quinte West | 870 |
| Saguenay | 425 |
Source: Statistics Canada, Census Profile, 2021 Census of Population; Statistics Canada, 2021 Census boundary files (simplified).
Highest share of recent immigrants, metropolitan areas
| Metropolitan area | Share | People |
|---|---|---|
| Toronto | 6.4% | 391,680 |
| Regina | 6.1% | 14,980 |
| Vancouver | 5.9% | 154,820 |
| Calgary | 5.8% | 85,620 |
| Winnipeg | 5.7% | 46,500 |
| Saskatoon | 5.6% | 17,515 |
| Edmonton | 5.3% | 74,700 |
| Kitchener - Cambridge - Waterloo | 4.9% | 27,780 |
| Moncton | 4.2% | 6,460 |
| Ottawa - Gatineau | 4.0% | 58,295 |
| Red Deer | 4.0% | 3,920 |
| Halifax | 3.9% | 18,135 |
| Montréal | 3.9% | 162,255 |
| London | 3.8% | 20,495 |
| Windsor | 3.8% | 15,830 |
| Guelph | 3.7% | 6,000 |
| Abbotsford - Mission | 3.6% | 6,845 |
| Fredericton | 3.5% | 3,725 |
| Hamilton | 3.4% | 26,545 |
| Lethbridge | 3.0% | 3,640 |
Source: Statistics Canada, Census Profile, 2021 Census of Population.
Recent immigrants by place of birth, Canada
Top 15 places of birth, 2016 to 2021 arrivals.
| Place of birth | People |
|---|---|
| India | 246,995 |
| Philippines | 151,490 |
| China | 118,035 |
| Syria | 63,130 |
| Nigeria | 40,360 |
| United States of America | 39,875 |
| Pakistan | 36,255 |
| France | 27,175 |
| Iran | 25,650 |
| United Kingdom | 22,755 |
| Korea, South | 20,985 |
| Brazil | 19,895 |
| Iraq | 17,715 |
| Mexico | 17,150 |
| Eritrea | 16,330 |
Source: Statistics Canada, Census Profile, 2021 Census of Population.
For arrivals after the census.
The census is a snapshot of May 2021. For permanent residents admitted since then, see the Immigration Data Explorer, which is updated monthly.