- Home
- Census Atlas
- Canada
Who lives in Canada.
36,991,981 people lived in Canada on Census Day 2021. 23.0% were immigrants, the highest share since Confederation, and 17.6% were second generation (born in Canada with at least one parent born abroad).
Data 2021 CensusNext update Census 2026 (from Feb. 2027)
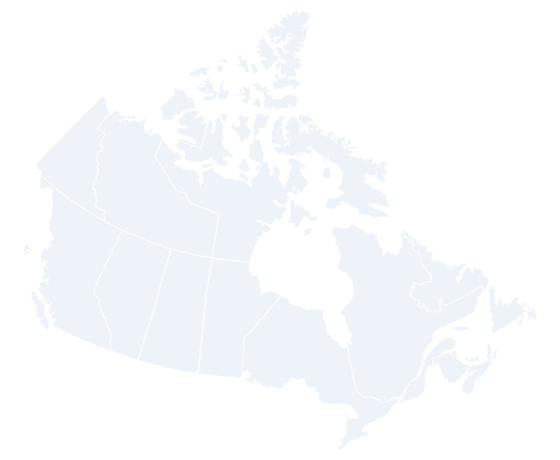
Immigrants as a share of residents
By province and territory.
| Province or territory | Immigrants |
|---|---|
| Ontario | 30.0% |
| British Columbia | 29.0% |
| Alberta | 23.2% |
| Manitoba | 19.7% |
| Quebec | 14.6% |
| Yukon | 13.6% |
| Saskatchewan | 12.5% |
| Northwest Territories | 10.3% |
| Prince Edward Island | 7.8% |
| Nova Scotia | 7.5% |
| New Brunswick | 5.8% |
| Nunavut | 3.2% |
| Newfoundland and Labrador | 2.8% |
Source: Statistics Canada, Census Profile, 2021 Census of Population; Statistics Canada, 2021 Census boundary files (simplified).
Recent immigrants (2016 to 2021)
Share of residents.
| Province or territory | 2016 to 2021 |
|---|---|
| Alberta | 4.6% |
| Manitoba | 4.5% |
| Ontario | 4.2% |
| British Columbia | 4.0% |
| Saskatchewan | 3.9% |
| Prince Edward Island | 3.2% |
| Yukon | 2.8% |
| Quebec | 2.4% |
| Nova Scotia | 2.2% |
| New Brunswick | 2.1% |
| Northwest Territories | 2.0% |
| Newfoundland and Labrador | 0.8% |
| Nunavut | 0.7% |
Source: Statistics Canada, Census Profile, 2021 Census of Population; Statistics Canada, 2021 Census boundary files (simplified).
Who lives in Canada, in charts.
Visible minority groups
Share of the population in private households. Statistics Canada term, defined in the Employment Equity Act.
| Group | Share | People |
|---|---|---|
| South Asian | 7.1% | 2,571,400 |
| Chinese | 4.7% | 1,715,770 |
| Black | 4.3% | 1,547,870 |
| Filipino | 2.6% | 957,355 |
| Arab | 1.9% | 694,015 |
| Latin American | 1.6% | 580,235 |
| Southeast Asian | 1.1% | 390,340 |
| West Asian | 1.0% | 360,495 |
| Multiple visible minorities | 0.9% | 331,805 |
| Korean | 0.6% | 218,140 |
| Visible minority, n.i.e. | 0.5% | 172,885 |
| Japanese | 0.3% | 98,890 |
Source: Statistics Canada, Census Profile, 2021 Census of Population.
Languages spoken most often at home
Non-official languages, single responses.
| Group | Share | People |
|---|---|---|
| Mandarin | 1.4% | 530,945 |
| Punjabi (Panjabi) | 1.4% | 520,390 |
| Yue (Cantonese) | 1.1% | 393,430 |
| Spanish | 0.9% | 317,365 |
| Arabic | 0.8% | 285,915 |
| Tagalog (Pilipino, Filipino) | 0.8% | 275,045 |
| Urdu | 0.4% | 158,040 |
| Iranian Persian | 0.3% | 125,840 |
| Russian | 0.3% | 125,780 |
| Korean | 0.3% | 125,525 |
Source: Statistics Canada, Census Profile, 2021 Census of Population.
Top 15 ethnic or cultural origins
People can report more than one origin, so shares add up to more than 100%.
| Group | Share | People |
|---|---|---|
| Canadian | 15.6% | 5,677,205 |
| English | 14.7% | 5,322,830 |
| Irish | 12.1% | 4,413,120 |
| Scottish | 12.1% | 4,392,200 |
| French | 11.0% | 3,985,945 |
| German | 8.1% | 2,955,695 |
| Chinese | 4.7% | 1,713,870 |
| Italian | 4.3% | 1,546,390 |
| Indian (India) | 3.7% | 1,347,715 |
| Ukrainian | 3.5% | 1,258,635 |
| Dutch | 2.7% | 988,585 |
| Polish | 2.7% | 982,820 |
| Québécois | 2.7% | 981,635 |
| British Isles | 2.6% | 938,950 |
| Filipino | 2.5% | 925,490 |
Source: Statistics Canada, Census Profile, 2021 Census of Population.
Immigrants: top places of birth
Share of all residents born in each place (immigrants only).
| Group | Share | People |
|---|---|---|
| India | 10.7% | 898,050 |
| Philippines | 8.6% | 719,580 |
| China | 8.6% | 715,835 |
| United Kingdom | 5.6% | 464,135 |
| United States of America | 3.1% | 256,090 |
| Pakistan | 2.8% | 234,105 |
| Hong Kong | 2.6% | 213,855 |
| Italy | 2.4% | 204,065 |
| Iran | 2.2% | 182,940 |
| Viet Nam | 2.2% | 182,095 |
| Jamaica | 1.7% | 145,360 |
| Korea, South | 1.7% | 138,355 |
Source: Statistics Canada, Census Profile, 2021 Census of Population.
Recent immigrants (2016 to 2021): top places of birth
Share of all residents.
| Group | Share | People |
|---|---|---|
| India | 18.6% | 246,995 |
| Philippines | 11.4% | 151,490 |
| China | 8.9% | 118,035 |
| Syria | 4.8% | 63,130 |
| Nigeria | 3.0% | 40,360 |
| United States of America | 3.0% | 39,875 |
| Pakistan | 2.7% | 36,255 |
| France | 2.0% | 27,175 |
| Iran | 1.9% | 25,650 |
| United Kingdom | 1.7% | 22,755 |
Source: Statistics Canada, Census Profile, 2021 Census of Population.
Immigrants by period of arrival
| Category | Share of residents |
|---|---|
| Before 1980 | 4.2% |
| 1980 to 1990 | 2.5% |
| 1991 to 2000 | 4.2% |
| 2001 to 2010 | 5.3% |
| 2011 to 2015 | 3.1% |
| 2016 to 2021 | 3.7% |
Source: Statistics Canada, Census Profile, 2021 Census of Population.
Immigrants admitted 1980 to 2021, by category
Share of residents.
| Category | Share of residents |
|---|---|
| Economic immigrants | 53.9% |
| Immigrants sponsored by family | 29.6% |
| Refugees | 15.2% |
| Other immigrants | 1.3% |
Source: Statistics Canada, Census Profile, 2021 Census of Population.